 Every year, the Energy Information Administration (EIA) publishes an Annual Energy Outlook with long-term projections about the U.S. energy market. The following are a few highlights of the early release of the 2013 reference case projections (AEO2013). These projections were made under the premise that current rules and regulations remain generally unchanged throughout the projection period, which runs through 2040. The projections contained herein are made by the EIA and should not be considered as Burns & McDonnell’s projections.
Natural Gas
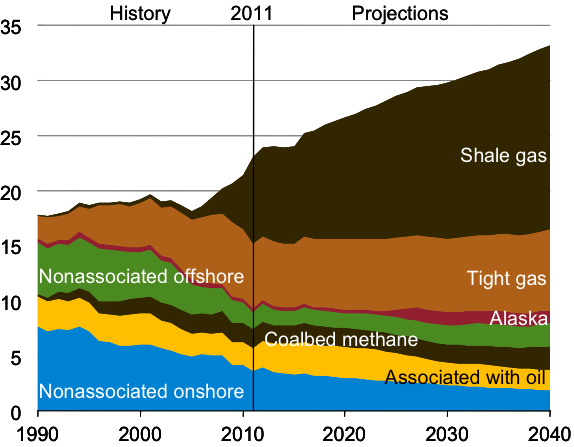
Production: Production of natural gas — primarily shale gas — is projected to continue to increase due to several factors. Improved drilling efficiencies and sustained low prices spur increased demand in the industrial, electric power and transportation sectors, as well as an increased demand for exports. The U.S. is predicted to become a net exporter of liquefied natural gas starting in 2016 (the same as in the AEO2012), a net exporter of pipeline natural gas starting in 2021 (three years earlier than in the AEO2012), and an overall net exporter of natural gas by 2020 (two years earlier than in the AEO2012). Production is projected to continue despite low prices, since high crude oil prices will continue to improve the economics of plays with high liquids content. See below for a visual depiction of the AEO2013 projections for natural gas production through 2040.
Figure 1. U.S. dry natural gas production by source, 1990-2040 (trillion cubic feet)
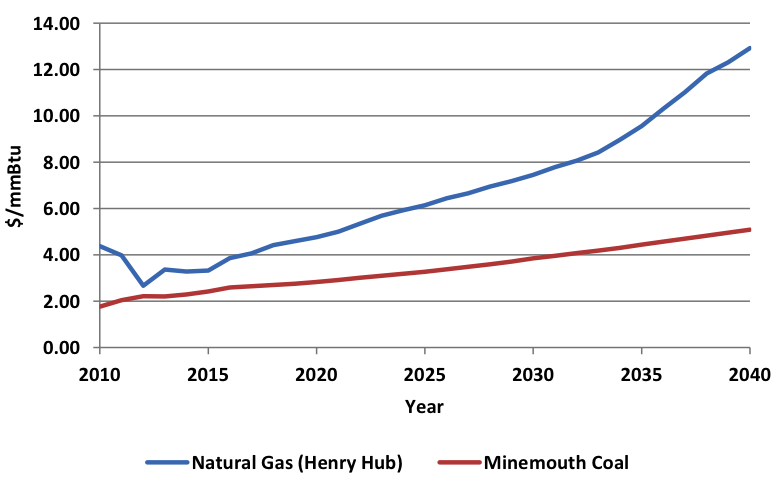
Prices: With this shale gas production outlook, nominal natural gas prices are projected to remain in the sub $4 per million Btu range through 2017 and then slowly increase through 2040. Nominal prices increase at an average annual rate of approximately 5.2 percent from 2018 through 2040. Figure 2 shows the AEO2013 projections for the spot price of natural gas at Henry Hub through 2040.
Risks: Hydraulic fracturing is a relatively new extraction technique and the environmental and public health side effects are still being studied. Increased regulations or drilling moratoriums could dampen the production outlook or increase natural gas prices in the long term. Pipeline infrastructure and availability will likely also add to the cost pressure that end-users will face.
Coal
Production: Domestic coal production is projected to increase at an average annual rate of 0.2 percent per year. Due to low natural gas prices and anticipated retirement of coal-fired generating capacity, however, production will decrease in the near term. After 2016, production gradually increases due to export and electric power demand.
Prices: The average nominal minemouth price of coal is projected to increase at an average annual rate of approximately 3 percent from 2013 through 2040. Figure 2 shows the AEO2013 projections for the average minemouth price of coal through 2040.
Risks: Electricity generation accounted for 91 percent of total U.S. coal consumption on a Btu basis. If the U.S. economy doesn’t recover as projected in the AEO2013, coal prices and production will face further downward pressure from less than expected domestic demand. Similarly, exports may face downward pressure if the global economy does not recover as projected. In addition to economic concerns, there are also environmental and regulatory headwinds to consider in the long term.
Figure 2. Nominal natural gas and coal price projections, 2010-2040 ($/mmBtu)
Renewables
Production: In the AEO2013, renewable energy production growth is primarily driven by the implementation of state renewable portfolio standard (RPS) mandates. Excluding hydroelectric power, biomass (24 percent) and wind (44 percent) make up two-thirds of the growth from 2011 to 2040. Solar photovoltaic has the fastest growth, albeit starting from a smaller base.
Prices: Capital cost updates for renewable technologies resulted in a reduction to initial cost for both wind (13 percent) and solar PV (22 percent). Federal subsidies for renewable generation were assumed to expire as enacted.
Risks: Development of renewable energy projects will likely be influenced by federal subsidies, natural gas prices and capital costs.
Energy Mix Outlook
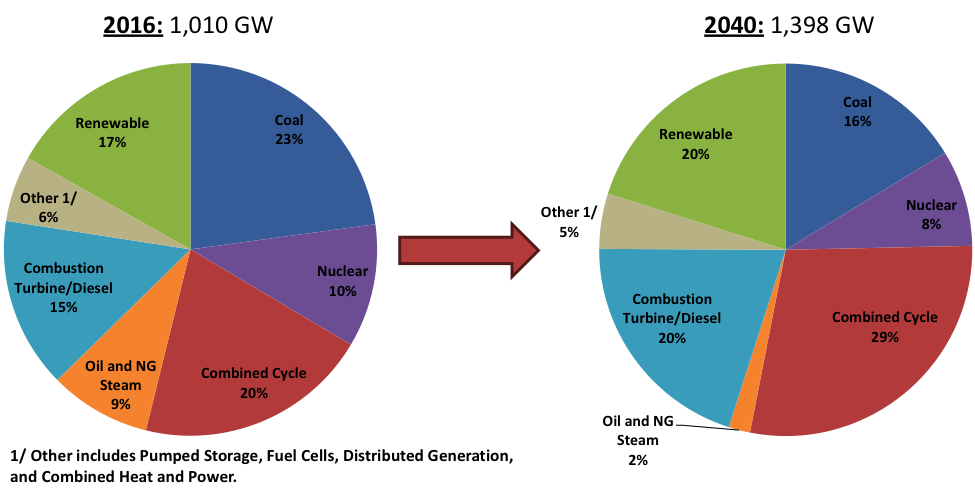
Natural gas prices continue to put pressure on other types of generation throughout the AEO2013 projections. Coal remains the largest fuel source for electricity production; however, its share of electricity generation declines from 42 percent to 35 percent from 2011 to 2040. Natural gas grows from 25 percent of electricity generation in 2011 to 30 percent of electricity generation in 2040. The AEO2013 assumes approximately 46 gigawatts (GW) of coal capacity will be retired by 2016 with the implementation of Clean Air Interstate Rule and Mercury and Air Toxics Standard environmental regulations. Figure 3 shows the share of generation capacity by fuel type in 2016 versus 2040, which illustrates the decline of coal and rise of natural gas-based generation.
Figure 3. Net generation capacity by fuel type, 2016 and 2040
Natural gas continues to dominate the discussion around trends in the U.S. energy industry. Price and availability will be important risk factors to monitor. Another emerging trend is the economic recovery and the related energy demand recovery. The AEO2013 and other projections contemplate reduced energy use per capita compared to pre-recession levels. This will be an important factor in the recovery of energy sales in the electric utility industry.
If you have any interest in learning more about Burns & McDonnell’s experience in long-range planning please visit our website. And if you’d like to discuss any of these long-term projections and how they might affect your capital projects and planning, contact Matt Lind.
Matt Lind is a Senior Project Manager with Burns & McDonnell and facilitates marketing and project management activities for studies related to resource and transmission planning. He’s worked in the utility and energy sector since 2004, during which he’s specialized in the development of economic models and analyses associated with resource planning.